Full ADP Chart
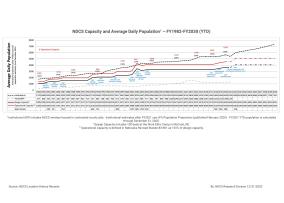
The graphic to the right shows the actual and projected changes in the design and operational capacities of the 10 NDCS facilities, as well as the average daily population (ADP) of the Department, between Fiscal Years 1982 and 2020.Read more